
Welcome back to the fourth installment of this series! I plan to take a different approach for this article so that I can better answer the question of whether or not there’s a clinically meaningful correlation between the triglyceride-to-HDL ratio (TG/HDL ratio) and insulin sensitivity. (This claim is made in “The Carnivore Code” and elsewhere in the nutritionsphere and was the focus of the last two articles in this series.) Instead of vetting another referenced claim made in “The Carnivore Code,” I plan to find and assess at least a couple high-quality studies that try to determine the correlation between the TG/HDL ratio and insulin sensitivity—akin to an informal literature review. I may return to assessing references for claims made in “The Carnivore Code” in future articles, though I’m selfishly interested in trying to improve my and other people’s understanding of this topic and am thus taking it upon myself to figure out what well-done research suggests.
To give more context, I’ve opted for the change because the first three articles of this series give me little confidence that the references cited in “The Carnivore Code” are studies that are well-suited to answer this question. For example, in the second and third articles in this series, I evaluated the two references Dr. Saladino cited to support the claims that 1) HDL rises and triglycerides decrease with insulin resistance and 2) that HDL correlates with insulin sensitivity. In both cases, the studies cited were designed to assess claims other than the claims Dr. Saladino made while referencing them. Additionally, the findings of all three studies I’ve assessed have partially contradicted the claims Dr. Saladino made.
To reiterate a point made in previous installments of this series, I’m not trying to “debunk” “The Carnivore Code” or smear Dr. Saladino. This venture is an honest and good-faith inquiry into the veracity of the claims made in the book for the purpose of helping myself and others. I don’t know the content of these pieces until I investigate and report the relevant research. So without further delay, let’s see what the research suggests.
To my pleasant surprise, there’s an abundance of papers that try to address the relationship between the TG:HDL ratio and insulin sensitivity. The first study I reviewed, “High triglycerides to HDL-cholesterol ratio is associated with insulin resistance in normal-weight healthy adults” (link) was published in 2019 by Pantoja-Torres et al. The study participants were 118 healthy-weight Latin American adults (older than 18 and younger than 60) with neither metabolic syndrome nor thyroid conditions. Below are the graphs showing the correlational relationships between these variables with r-values and p-values included. Of note, the axes are logarithmic, and this formatting may cause the data to appear to more clustered, especially at the extremes.
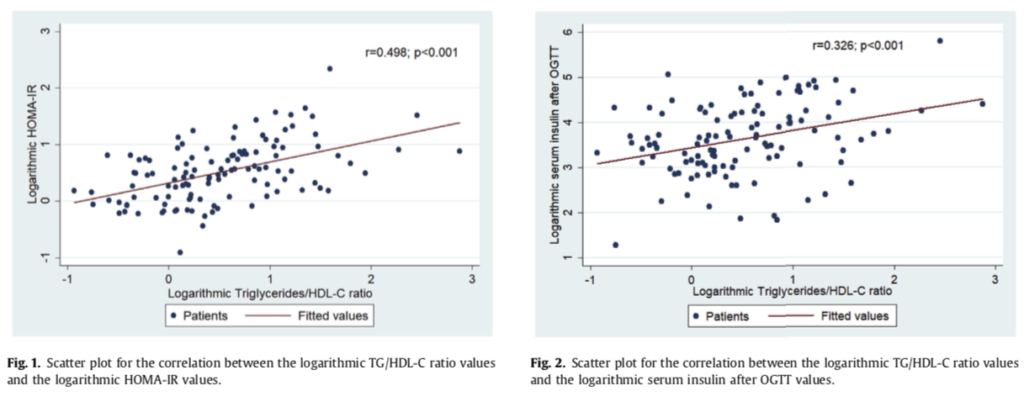
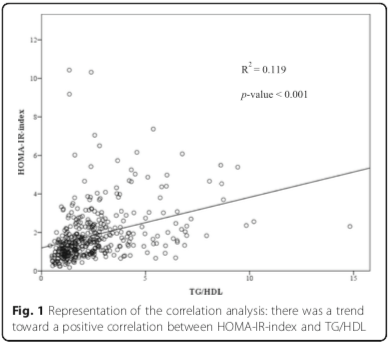
For those of you who could a refresher on statistics, an r-value between 0.1-0.3 is generally considered weak, 0.3-0.6 is considered moderate strength, and greater than 0.7 is considered strong. Thus, this study found a moderate correlation between the TG/HDL ratio and insulin resistance (as measured by HOMA-IR) as well as a weak-to-moderate correlation between the TG/HDL ratio and hyperinsulinemia after an OGTT. It’s difficult for me to precisely assess the degree to which these correlations are clinically meaningful, though an r-value of 0.498 leaves me slightly underwhelmed about its potential clinical utility. That said, I’m curious to see how this finding fits within the context of the broader literature. In the next study, “Elevated triglyceride-to-HDL cholesterol ratio is an indicator for insulin resistance in middle-aged and elderly Taiwanese population: a cross-sectional study” (link) was published in 2019 by Yeh et al. The researchers assessed 398 adults with an average age of 64.43 years (SD = 8.45), an average BMI of 24.54 (SD = 3.57), a mean HOMA-IR of 1.86 (SD = 1.39), and a mean TG/HDL ratio of 2.52 (SD = 1.83). Thus, these adults seem to be a reasonably heterogenous and representative adult population (though I suspect American adults would likely be unhealthier by many or all metrics, but I digress). The researchers collected a slew of measures, including triglycerides, HDL, HOMA-IR, blood pressure, and waist circumference. Like the researchers in the previous study, they quantified the strength of the correlation between the various measures and HOMA-IR and found that the TG/HDL ratio had an r-value of 0.35, HDL had an r-value of -0.31, waist circumference had an r-value of 0.41, and fasting plasma glucose had an r-value of 0.50. The correlation between the TG/HDL ratio and HOMA-IR was weaker in this study than in the previous paper, and would generally be considered to have weak-to-moderate strength. Notably, the strength of the inverse correlation between HDL and HOMA-IR (-0.31) was also weak-to-moderate, which seems to argue against claims that HDL is a clinically meaningful indicator of insulin sensitivity. Below is the graph representing the correlation between the TG/HDL ratio and HOMA-IR, with the r-squared and p-value included.
Additionally, the authors used an ROC curve to determine that the optimal cut-off point for using the TG/HDL ratio to predict insulin resistance (as defined by HOMA-IR > 2) was 2.197. This cut-off corresponded to a sensitivity of 72.4% and a specificity of 65.1%, both of which are of low-to-moderate strength. Expressed another way, for every person hundred people who are correctly diagnosed with insulin resistance based on their TG:HDL ratio (i.e., true positives), approximately 38 would be told that they didn’t have insulin resistance even though their HOMA-IR indicated insulin resistance (i.e., false negatives). Likewise, for every hundred people told that they didn’t have insulin resistance based on their TG:HDL ratio (i.e., true negatives), nearly 54 would incorrectly diagnosed as insulin resistant based on their TG:HDL ratio (i.e., false positives). All that to say, the HDL:TG ratio seems to be a poor diagnostic tool for insulin resistance in this group of participants and not something I would want to rely on clinically.
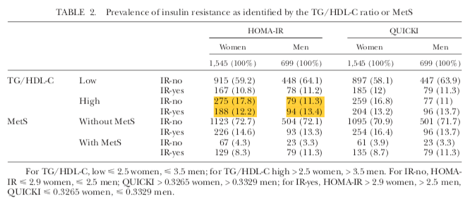
The last study I’ll review in this article is the 2013 paper by Murguia-Romero et al. titled, “Plasma triglyceride/HDL-cholesterol ratio, insulin resistance, and cardiometabolic risk in young adults” (link). The researchers collected a variety of measures from 2,244 college students (age range 17-24) in Mexico City. The researchers defined abnormal as the 25% of the population with the highest TG/HDL ratio (which was > 3.5 for men and > 2.5 for women), and defined insulin resistance as the 25% of the population with the highest HOMA-IR. The researchers didn’t do a correlational analysis, though they did calculate the sensitivity and specificity of the TG/HDL ratio for identifying insulin resistance in men and women separately. The sensitivity was 53% for women and 55% for men, while the specificity was 77% for women and 85% for men. To quote the authors, “Neither the TG/HDL-C ratio nor the MetS [metabolic syndrome] criteria identify IR [insulin resistant] individuals with great sensitivity, but both show reasonable specificity.” In other words, the TG/HDL ratio might work reasonably well as a confirmatory test in this population because it had a low false positive rate, though it had a high false negative rate.
To that point, the table below shows that an elevated TG/HDL ratio misses many cases of insulin resistance, especially in the sample of women. For every 100 women with an elevated TG/HDL ratio, approximately 41 would have insulin resistance, while 59 wouldn’t. Likewise, for every 100 men with an elevated TG/HDL ratio, approximately 54 would have insulin resistance, whereas 46 wouldn’t. Thus, knowing that someone in this study had an abnormal TG/HDL ratio gives them approximately a 50-50 chance of having insulin resistance, which seems far from clinically useful. On the other hand, someone with a “normal” TG/HDL ratio would have approximately a 15% chance of being insulin resistant, which could be clinically useful. Of course, clinicians usually have an assortment of data points when making such evaluations and thus don’t usually need to rely only on the TG/HDL ratio to make decisions. Nevertheless, the data seems to caution against interpreting the TG/HDL ratio as a strong marker of insulin resistance or sensitivity.
To sum up this informal literature review, the first two studies found that the TG/HDL ratio had a moderate and weak-to-moderate correlation with insulin sensitivity. Additionally, the second study found that HDL had a weak-to-moderate inverse correlation with insulin sensitivity, which argues against the claim that HDL is a clinically meaningful marker of insulin sensitivity. The latter two studies reported the sensitivity and specificity of the TG/HDL ratio as a predictor of insulin resistance, with the second study finding low-to-moderate sensitivity and specificity while the third study found low sensitivity and moderate-to-high specificity. Notably, it was mentioned in the discussion of multiple studies that the diagnostic utility of the TG/HDL ratio seems to vary by ethnic demographic. That said, each of these studies studied a particular ethnic demographic and each of study found that the TG:HDL ratio didn’t correlate strongly with insulin sensitivity. My takeaway from these three studies is that the TG/HDL is a poor and unreliable proxy for insulin sensitivity. Perhaps it can be useful for assessing insulin sensitivity when considered in the context of other variables, though I have yet to see research to support that claim.
While I may return to this topic in future articles, I intend to explore different claims made in “The Carnivore Code” in the next few installments of this series. Based on the findings of the last three articles, I’m fairly confident that the TG/HDL ratio and HDL aren’t great indicators of insulin sensitivity (though I’m happy to be proven wrong) and am eager to investigate other topics. If you have any requests for topics to be covered in future articles, then leave a comment below to let me know!
References:
Murguía-Romero, M., Jiménez-Flores, J. R., Sigrist-Flores, S. C., Espinoza-Camacho, M. A., Jiménez-Morales, M., Piña, E., Méndez-Cruz, A. R., Villalobos-Molina, R., & Reaven, G. M. (2013). Plasma triglyceride/HDL-cholesterol ratio, insulin resistance, and cardiometabolic risk in young adults. Journal of Lipid Research, 54(10), 2795–2799. https://doi.org/10.1194/jlr.M040584
Pantoja-Torres, B., Toro-Huamanchumo, C. J., Urrunaga-Pastor, D., Guarnizo-Poma, M., Lazaro-Alcantara, H., Paico-Palacios, S., del Carmen Ranilla-Seguin, V., & Benites-Zapata, V. A. (2019). High triglycerides to HDL-cholesterol ratio is associated with insulin resistance in normal-weight healthy adults. Diabetes & Metabolic Syndrome: Clinical Research & Reviews, 13(1), 382–388. https://doi.org/10.1016/j.dsx.2018.10.006
Saladino, P. (2020). The Carnivore Code: Unlocking the Secrets to Optimal Health by Returning to Our Ancestral Diet. New York: Houghton Mifflin Harcourt Publishing Company.
Yeh, W.-C., Tsao, Y.-C., Li, W.-C., Tzeng, I.-S., Chen, L.-S., & Chen, J.-Y. (2019). Elevated triglyceride-to-HDL cholesterol ratio is an indicator for insulin resistance in middle-aged and elderly Taiwanese population: A cross-sectional study. Lipids in Health and Disease, 18(1), 176. https://doi.org/10.1186/s12944-019-1123-3
2 comments for “Fact-Checking “The Carnivore Code,” by Dr. Paul Saladino, Part Four: Triglycerides, HDL, and Insulin Resistance, Round Three”